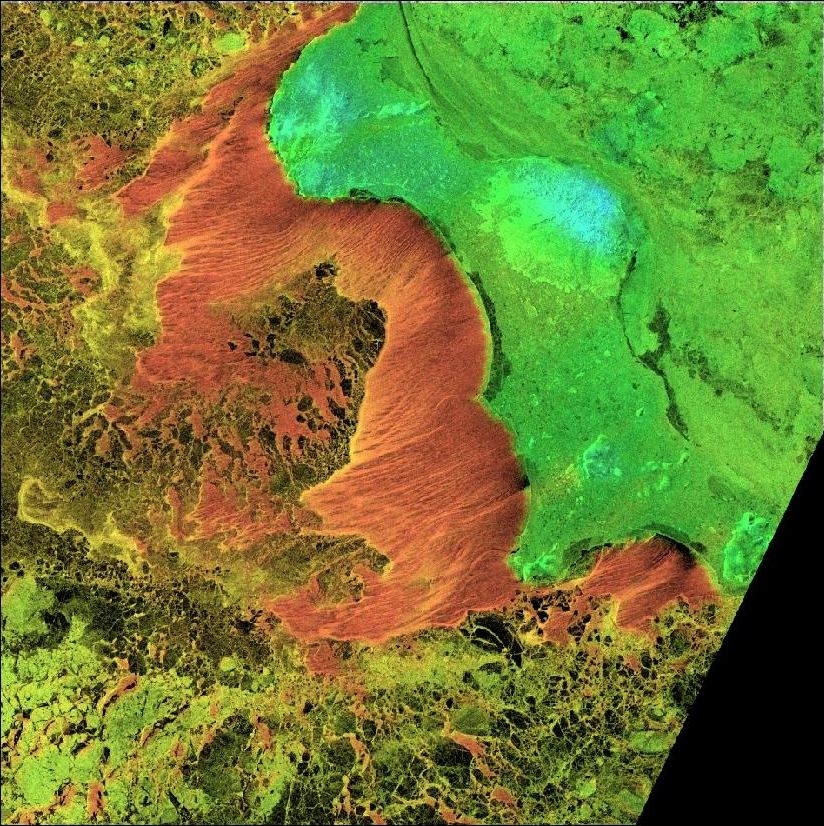
The image you see here is a false-color composite image formed using data from two separate instruments on two different satellites. The value, or light-dark content of the image, is controlled by data from the Synthetic Aperture Radar, or SAR, instrument aboard the Canadian Space Agency's RADARSAT satellite, which measures radar backscatter from the earth's surface and forms a high resolution "picture" of surface features. The hue, or color content of the image, is proportional to sea surface temperature, or SST, calculated from infrared radiance measured by the Advanced Very High Resolution Radiometer (AVHRR) aboard the National Oceanic and Atmospheric Administration's NOAA-12 satellite. The two component images were acquired within approximately 35 minutes of eachother on January 9, 1999 over St. Lawrence Island in the Bering Sea, and together present a vivid picture of a persistent ice feature known as the St. Lawrence Polynya. The scale of the image is approximately 160 km across. (For a detailed description of how this image was made, including the component SAR and AVHRR images, click here.)
The St. Lawrence Polynya is a persistent wind-driven polynya that forms along the southern coast of St. Lawrence Island, a large island located south of the Bering Strait between Alaska and northeastern Russia. The prevailing winds are from the north and east; on the day of this image the wind is blowing from the northeast at about 15 m/s (about 30 mph), pushing ice away from the coast and opening the relatively warm (-1.8 deg. C) water to the colder (-14 deg. C) air, where it quickly refreezes into a slurry of small ice crystals known as frazil ice. The long, feathery streaks visible in the polynya are called Langmuir cells, formed by wind-herding of the newly formed frazil ice. The red color in this area of the image, indicating a relatively warm surface temperature, stands in contrast to the colder surrounding surface temperatures indicated by yellows and greens. The structure of the surrounding ice is also revealed by the SAR, which shows the characteristic round or oval shapes of floes, solid "islands" of older ice that have been pushed southward by the wind.
For more about the composite SAR/AVHRR images, and images of other days, click in the list below:
In Arctic seas during the winter months, the direction of heatflux is predominantly from ocean to atmosphere (by convention, negative.) In a wind-driven polynya, the relatively warm ocean water is exposed to cold air, resulting in large negative heatfluxes. Since the rate at which ice forms is proportional to the rate at which heat is removed from the water, we can use heatflux to estimate ice thickness. During the period of our study, two Upward Looking Sonars (ULS) were deployed in the St Lawrence polynya, provided and analyzed by Richard Moritz of the University of Washington Polar Science Center. These are capable of returning detailed time series of ice draft. We can compare the output of these instruments with our satellite-based estimates of ice thickness in order to verify the accuracy of the satellite-based instruments and algorithms. This will, hopefully, enable us to develop reliable techniques to measure these surface quantities in broader and less accessible areas.
For a description of some of these techniques, including heatflux and ice thickness images based on AVHRR-derived sea surface temperature, and comparisons of the AVHRR-derived ice thicknesses with ULS ice draft measurements, click in the list below:
Heatflux and Ice Thickness
Concurrent coverage in the winter of 1998-9 of the St Lawrence polynya by several satellite and field instruments gives us a unique opportunity to study a large coastal polynya from a number of different viewpoints. The AVHRR data enables us to estimate the surface temperature, which we use to derive a number of secondary surface quantities. One of these is surface heatflux, or the rate at which energy is tranferred between the atmosphere and the ocean.
Related links:
Back to Polar Research Home Page..
© 2000 Robert Drucker, University of Washington. This material is based upon work supported by the National Science Foundation under Grant No. 9811097.