 Figure 1: Sea Surface Temperature from AVHRR channels 4 and 5
Figure 1 shows the first component image, sea surface temperature (SST), calculated from channels 4 and 5 of the Advanced Very High Resolution Radiometer (AVHRR) aboard the National Oceanic and Atmospheric Administration's NOAA-12 satellite. The surface temperature To is calculated using the Key-Haefliger algorithm:
where Tb4 and Tb5 are the channel 4 and 5 brightness temperatures, Z is the satellite zenith angle, and coefficients A,B,C and D are the Arctic snow-ice coefficients for the appropriate temperature range and satellite (cf Arctic Ice Surface Temperature Retrieval from AVHHR Thermal Channels, J. Key and M. Haefliger, JGR Vol. 97, No. D5, pp 5885-5893, April 20, 1992.)
Figure 1: Sea Surface Temperature from AVHRR channels 4 and 5
The resolution of the AVHRR is approximately 1 km.
The second component image is the Synthetic Aperture Radar (SAR) image from the Canadian Space Agency's RADARSAT satellite, which shows backscatter at a nominal resolution of 100 m. A 200m version of this image for Jan 9, 1999 is shown in Figure 2.
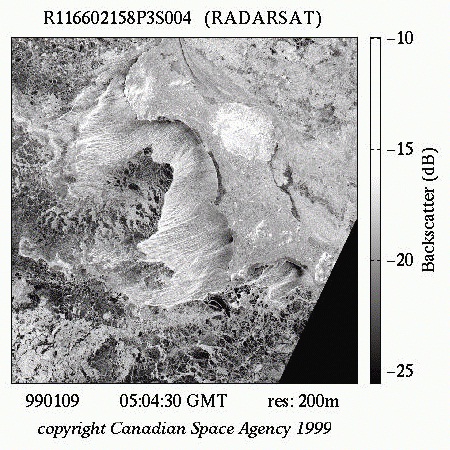 Figure 2: RADARSAT image.
This image contains the returned radar intensity (backscatter) from the surface, which is a function of a number of surface features, including open water surface roughness as well as the presence of different types of sea ice. Generally, smooth surfaces have low (dark) returns, while surfaces roughened by wind (for open water) or rough ice cover appear brighter (other surface characteristics, such as high salinity found in very new ice, may affect the return intensity as well.)
To combine the component images into a single composite, they must first be processed to a common map projection and grid. We chose a polar stereographic projection true at 70N as the common map projection. An intermediate resolution of 200m was used as a common grid size. The RADARSAT image is reduced to this resolution by 2x2 averaging of linear backscatter. The SST image is resampled to the 200m resolution by 2-D interpolation. The two images are then brought into alignment by using the island as a common reference, a step which is necessary due to small errors in the geolocation of the images (mainly due to satellite pitch and roll in the AVHRR.)
Finally, a composite RGB, or truecolor, image is formed in hue-saturation-value (HSV) color space by mapping SST values in the range -30 to 0 degrees C to hue values from 0 to 1, according to a fixed mapping function, and mapping SAR backscatter values in the range -25 to -10 dB to value (brightness) values from 0 to 1 according to a second mapping function. The third color dimension, saturation, was set at a fixed value of 70%. The resulting HSV image is then converted into RGB color space using an HSV to RGB transform function.
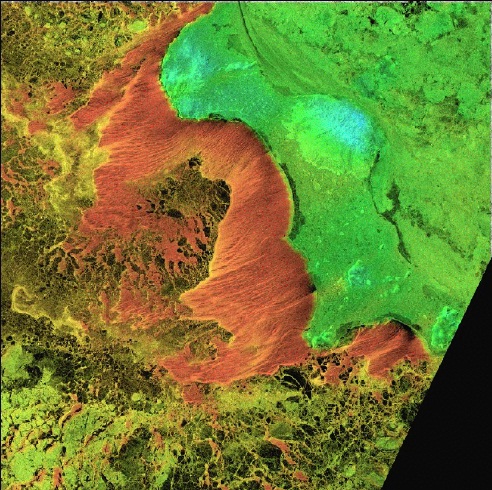 Figure 3: Composite image (9 Jan, 1999)
Acknowledgements: This is a joint study with Harry Stern of the University of Washington's Polar Science Laboratory, who provided the processing of the RADARSAT images. We are also indebted to Kevin Engle of the University of Alaska's Alaska SAR Facility for providing us with the AVHRR data for this study, to the National Oceanographic and Atmospheric Administration (NOAA), and to the Canadian Space Agency (CSA), for providing the RADARSAT data. All RADARSAT imagery used is copyright 1999 Canadian Space Agency.
Back to St Lawrence Polynya page
© 2000 Robert Drucker, University of Washington